Visualization of Quantum Programs
The Classiq analyzer application helps you visualize and analyze quantum programs. The input to the application is a quantum program synthesized by the Classiq synthesis engine, or an OpenQASM quantum program.Accessing the Quantum Program Visualization Tool
There are 3 ways to view a quantum program using the visualization tool:- Through the Classiq Python SDK
- Direct access via the Classiq IDE
- Direct access via the Studio
Classiq Python SDK
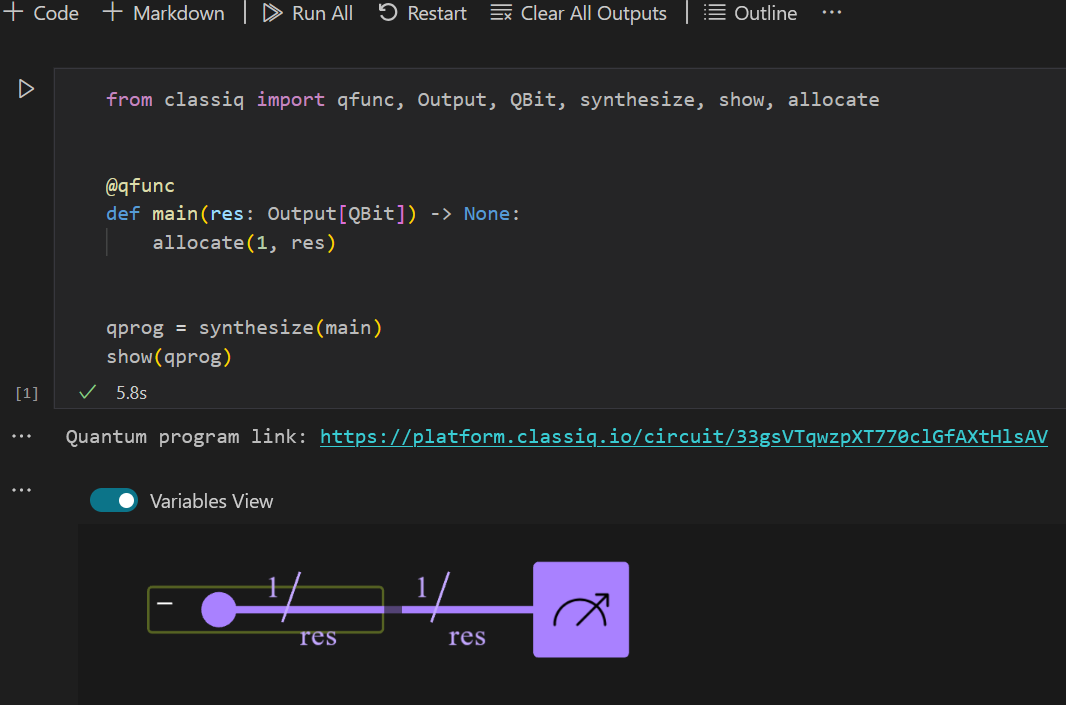
- Synthesize your model using
synthesize()to obtain a quantum program, and pass it as a parameter to the functionshow(). Here is an example with a trivial model:
Direct Access
- Synthesizing a quantum program using the IDE https://platform.classiq.io/synthesis automatically redirects you to the visualization tool.
- Upload (drag and drop) a file that contains a quantum program synthesized using the Classiq engine (either synthesized and downloaded from the IDE or obtained from the python SDK using
qprog.save_result("file-name")) into https://platform.classiq.io/circuit/.
Visualization in the Studio
- Follow the same steps as in Classiq Python SDK. The visualization tool can be directly rendered in the notebook:
Using Visualization Tool
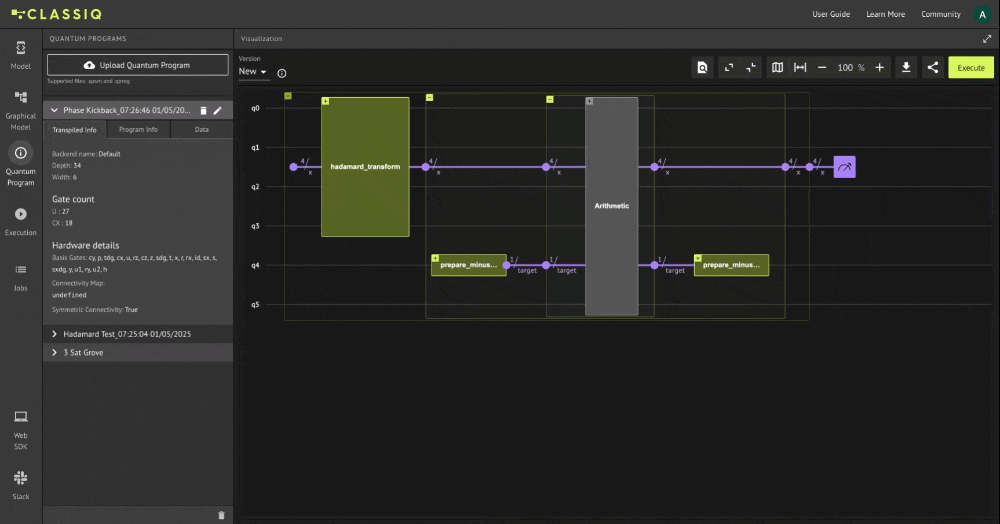
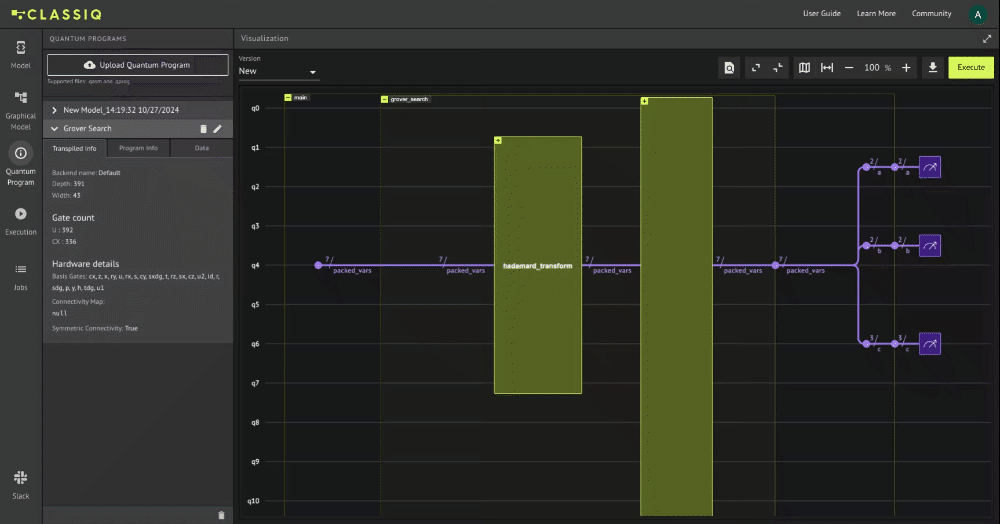
The Quantum Program visualization bridges the high-level algorithm descriptions (as it is captured in Qmod) with their quantum implementations (as synthesized by the Classiq engine). The tool offers two key innovations: functional block hierarchies and quantum data flow representations. The quantum data flow view lets users track quantum variables, including higher-level types like numbers, arrays, and structs, along with their qubit allocations. This aids in understanding data flow and memory allocation within quantum algorithms. Functional block hierarchies enable navigation between different levels of abstraction, from high-level functional blocks to individual quantum gates, offering a more thorough exploration of the algorithm’s structure. The QP visualization tool provides an interactive way to analyze quantum programs by focusing on the quantum data-flow between functional blocks. Here’s a breakdown of its key features and functionality:Purpose
- Analyze the implementation of the quantum model (Qmod) as synthesized by the Classiq engine.
- Verify the data flow within the quantum program, enabling debugging and deeper analysis
Hierarchical Structure
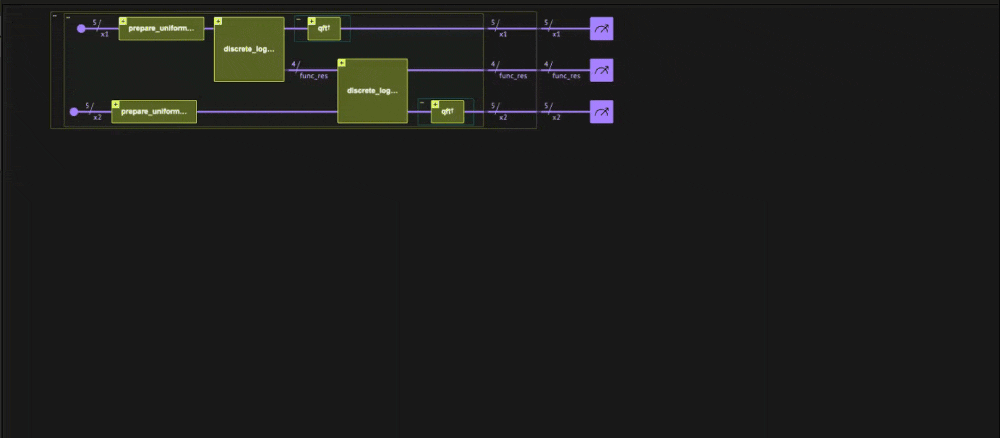
- Allows users to traverse different levels of the quantum model implementation, from high-level Qmod functions down to atomic functions. Double clicking a function block opens and collapses the internal hierarchies:
Color Coding
The visualization uses colors to help distinguish different block categories:- Yellow: Represents Qmod function blocks (either written by the user or taken from the Classiq library).
- Turquoise: Represents Qmod statement blocks (such as: control, invert, power, within-apply, assignment).
- Grey: Represents built-in functional blocks (generated by the Classiq engine during synthesis).
Data Flow Analysis
Data flow between functional blocks is presented in terms of the Qmod variables:- Purple lines represent the flow of quantum variables throughout the program.
- The purple dot marks where a variable is initialized.
- When variables split or merge (via slicing or the bind operation), the purple lines update to show the changes.
- The variable’s name and size are also displayed along the purple lines, making it easier to track their initialization, usage and transformations.
Task Bar
On the top right is the analyzer task bar: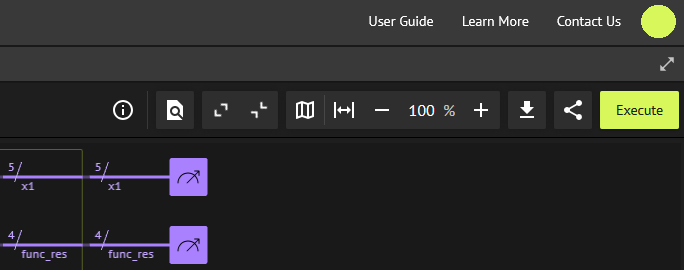
- Search tool: Allows you to search through the building blocks of a quantum program to quickly locate specific elements.
- Hierarchical View: Provides options to expand all functions and gates, revealing the most detailed level of analysis for the quantum gates used in your algorithm. You can also collapse everything to return to the original, simplified view displayed when the quantum program was first loaded, where a single bar represents the entire algorithm.
- Navigation and Zoom: This group includes map controls for navigating across different parts of the quantum program chart, enabling you to focus on gates and functions that are currently outside the visible area. It also includes zoom controls to:
- Reset the chart to its default scale (currently 90%),
- Zoom out,
- Adjust the zoom level manually,
- Or zoom in for a closer view.
Variables View
Within the Quantum Program page you can also toggle the Variables View option: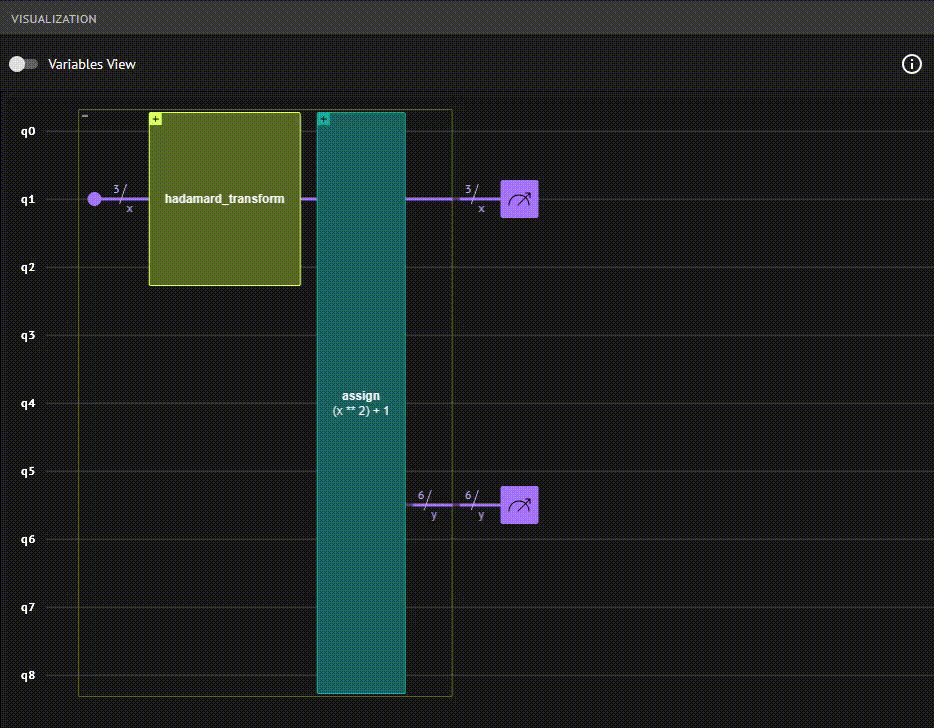
Sharing your Quantum Program Visualization
You can easily share your Quantum Program visualization with anyone, even those who haven’t signed up for the platform. It’s simple:- Copy the Quantum Program URL directly from your browser and share it.
- Alternatively, click the “Share” button on the Quantum Program page, choose a social media to share in or copy the generated link, and share it with anyone.